
AN alternative World Cup Wall Chart produced by a Northampton-based company is being snapped up across the county as the festival of football got under way in Brazil.
Low Energy Consultancy (LEC), who are based in Kingsthorpe in Northampton, work with businesses across the UK and are committed to assisting and guiding the property and construction worlds to comply with legislation, reduce CO2 emissions, energy costs and improve the marketability and value of buildings.
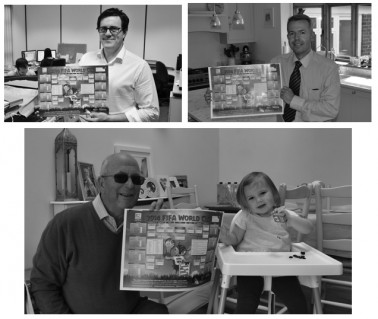
The company has published a traditional World Cup Wall Chart.
AN alternative World Cup Wall Chart produced by a Northampton-based company is being snapped up across the county as the festival of football got under way in Brazil.
Low Energy Consultancy (LEC), who are based in Kingsthorpe in Northampton, work with businesses across the UK and are committed to assisting and guiding the property and construction worlds to comply with legislation, reduce CO2 emissions, energy costs and improve the marketability and value of buildings.
The company has published a traditional World Cup Wall Chart. The difference is that LEC has seeded each team in line with their nation’s carbon footprint showing who the ‘green’ World Champions really are.
“The biggest show on earth is under way and as a business that works with businesses to address carbon emissions we wanted to look at the World Cup in an alternative way,” said Adam Alexander, Director at Low Energy Consultancy. “We’ve looked at the carbon footprints of all the nations taking part in Brazil and the Ivory Coast come out as Champions.”
The 2010 World Cup in South Africa had a carbon footprint of 2.8 million tonnes of CO2 which is the equivalent of 6,000 space shuttle flights or 20 cheeseburgers for every man, woman and child in the UK.
“Young and old love the World Cup and we all have memories from previous tournaments of filling in the results of each game on our bedroom wall chart and the LEC version is exactly the same,” said Adam. “The twist we have added is seeding the teams in the order of their carbon footprint. If the tournament follows that then the semi finals in July would see Ivory Coast, Cameroon, Ghana and Nigeria taking part – an African clean sweep.”
England are ranked 23rd out of the 32 teams with CO2 emissions of 8.5 tonnes per person. Tournament favourites Brazil are ranked tenth with 2.3 tonnes per person.
“There is of course a serious side to the wall chart,” said Adam. “We want to highlight how such a big tournament will affect the environment and we want to use the opportunity to advise businesses on some small steps they can take to reduce their impact.
“Our wall chart is great to fill in but also gives some top tips of how to save energy in the office. By following these tips, energy and money can be saved and business can be the real champions.”
For your free copy of the LEC World Cup Wall Chart visit www.lowenenergyconsultancy.co.uk